Step 1: Choose Your Core Six
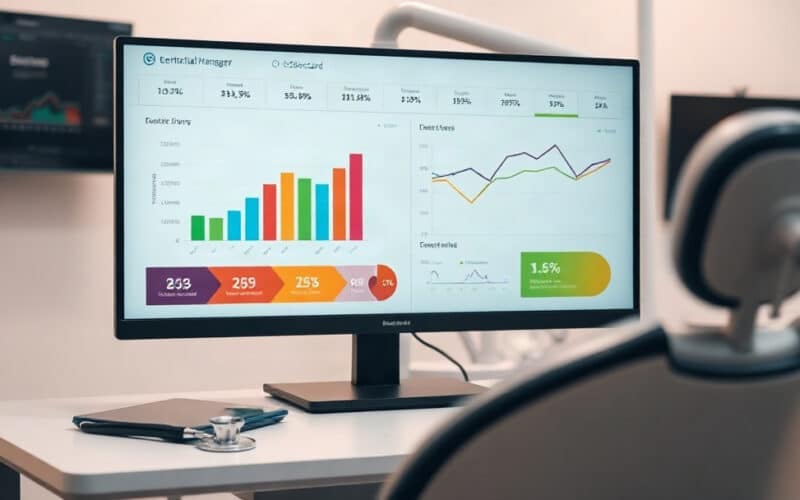
Start with the six metrics that have the highest impact on your specific situation. For most general practices, the core six are: collections rate, case acceptance, hygiene reappointment rate, overhead percentage, new patient flow, and production per provider. Customize based on your biggest pain point. If no-shows are killing your schedule, replace one metric with no-show rate.
Step 2: Set Benchmarks and Targets
Use the benchmarks in this guide as starting points, then adjust based on your market. A solo GP in rural Kansas operates in a different cost environment than a two-doctor practice in Manhattan. Your practice management software (Dentrix, Eaglesoft, Open Dental, Curve Dental, or Denticon) should generate most of these metrics automatically.
Step 3: Establish Review Rhythm
Review production and scheduling KPIs in your daily morning huddle. Review financial and operational KPIs weekly with your office manager. Conduct a full dashboard review monthly with the leadership team. Quarterly, compare your metrics to ADA benchmarks and set targets for the next 90 days.
Step 4: Assign Ownership
Every metric needs one person accountable for tracking it. Collections rate belongs to the billing coordinator. Hygiene reappointment rate belongs to the hygiene team lead. No-show rate belongs to the front desk supervisor. When nobody owns a metric, nobody monitors it.
Step 5: Act on Red Flags Within 7 Days
A KPI dashboard that nobody acts on is decorative. Set thresholds: if any core metric drops more than 10% from target for two consecutive weeks, trigger a root-cause analysis and corrective action within 7 days. The practices that outperform consistently are not the ones with perfect metrics. They are the ones that respond fastest when metrics slip.
KPI Benchmarks Summary Table
A healthy dental practice maintains a collections rate of 98%+, overhead of 58-65%, and a case acceptance rate of 75-85%.
| KPI | Benchmark | Red Flag | Tracking Frequency |
|---|---|---|---|
| Collections Rate | 98%+ | Below 95% | Monthly |
| Overhead Percentage | 58-65% | Above 68% | Monthly |
| Production Per Provider/Day | $3,000-$5,000 (GP) | Below $2,500 | Weekly |
| AR Over 90 Days | Under 15% of total AR | Above 20% | Monthly |
| Case Acceptance Rate | 75-85% | Below 60% | Weekly |
| Hygiene Reappointment Rate | 85-95% | Below 75% | Weekly |
| Hygiene-to-Restorative Ratio | $2.50-$3.50 per $1 hygiene | Below 2:1 | Monthly |
| Perio Treatment Rate | 30-40% | Below 20% | Monthly |
| New Patient Flow | 25-50/month per provider | Below 20 | Monthly |
| Patient Attrition | Under 15% annually | Above 20% | Quarterly |
| No-Show Rate | Under 5% | Above 10% | Weekly |
| Schedule Utilization | 85-95% | Below 80% | Weekly |
| Revenue Per Visit | $250-$400 (GP) | Below $200 | Monthly |
| Staff Cost Per Visit | $75-$120 | Above $130 | Monthly |
| Google Reviews | 4.7+ stars, 100+ total | Below 4.5 | Weekly |
Frequently Asked Questions
How many KPIs should a dental practice track?
Start with six core metrics and expand to 10-15 as your tracking discipline matures. Tracking 25+ KPIs creates data overload without improving decision-making. The practices with the best financial outcomes are not the ones tracking the most metrics. They are the ones consistently acting on 6-8 well-chosen indicators.
What software tracks dental practice KPIs automatically?
Most modern practice management systems generate KPI reports natively. Dentrix (Henry Schein) includes Practice Advisor reports. Eaglesoft (Patterson) provides the Intelligence Dashboard. Open Dental offers free reporting tools. Third-party platforms like Dental Intelligence, Jarvis Analytics, and Sikka Software aggregate data across multiple systems and provide benchmarking against peer practices. Databox and Klipfolio can build custom dashboards pulling from your PMS data.
What is the most important dental practice KPI?
Collections rate. Production means nothing if you don’t collect it. A practice producing $1.5M at 90% collections ($1.35M received) underperforms a practice producing $1.2M at 98% collections ($1.176M received) by a smaller margin than the production gap suggests, and the second practice typically has lower overhead and less stress because its systems are tighter.
How often should you review dental practice metrics?
Daily: production goals in your morning huddle. Weekly: scheduling, no-shows, case acceptance, and hygiene reappointment. Monthly: financial metrics (collections, overhead, AR aging). Quarterly: full benchmark comparison against ADA and industry data, plus goal-setting for the next 90 days.
What KPIs matter most for a new dental practice?
New practices should prioritize: new patient flow (the growth engine), case acceptance (converting consultations into treatment), collections rate (cash flow is survival in year one), and overhead percentage (which runs higher in startup phase at 70-80% before normalizing). Monitor daily production obsessively until you reach break-even.