Plug in your gross collections and category expenses. Get a side-by-side delta against ADA HPI 2026 benchmarks plus the three categories most likely to be over budget for a practice your size.
Skip to the data:
For related reading, see our guide on dental practice growth strategies.
💡 Use the tool: Compare your overhead against industry benchmarks with the free Overhead Calculator.
What Is Dental Practice Overhead and Why Does It Matter?
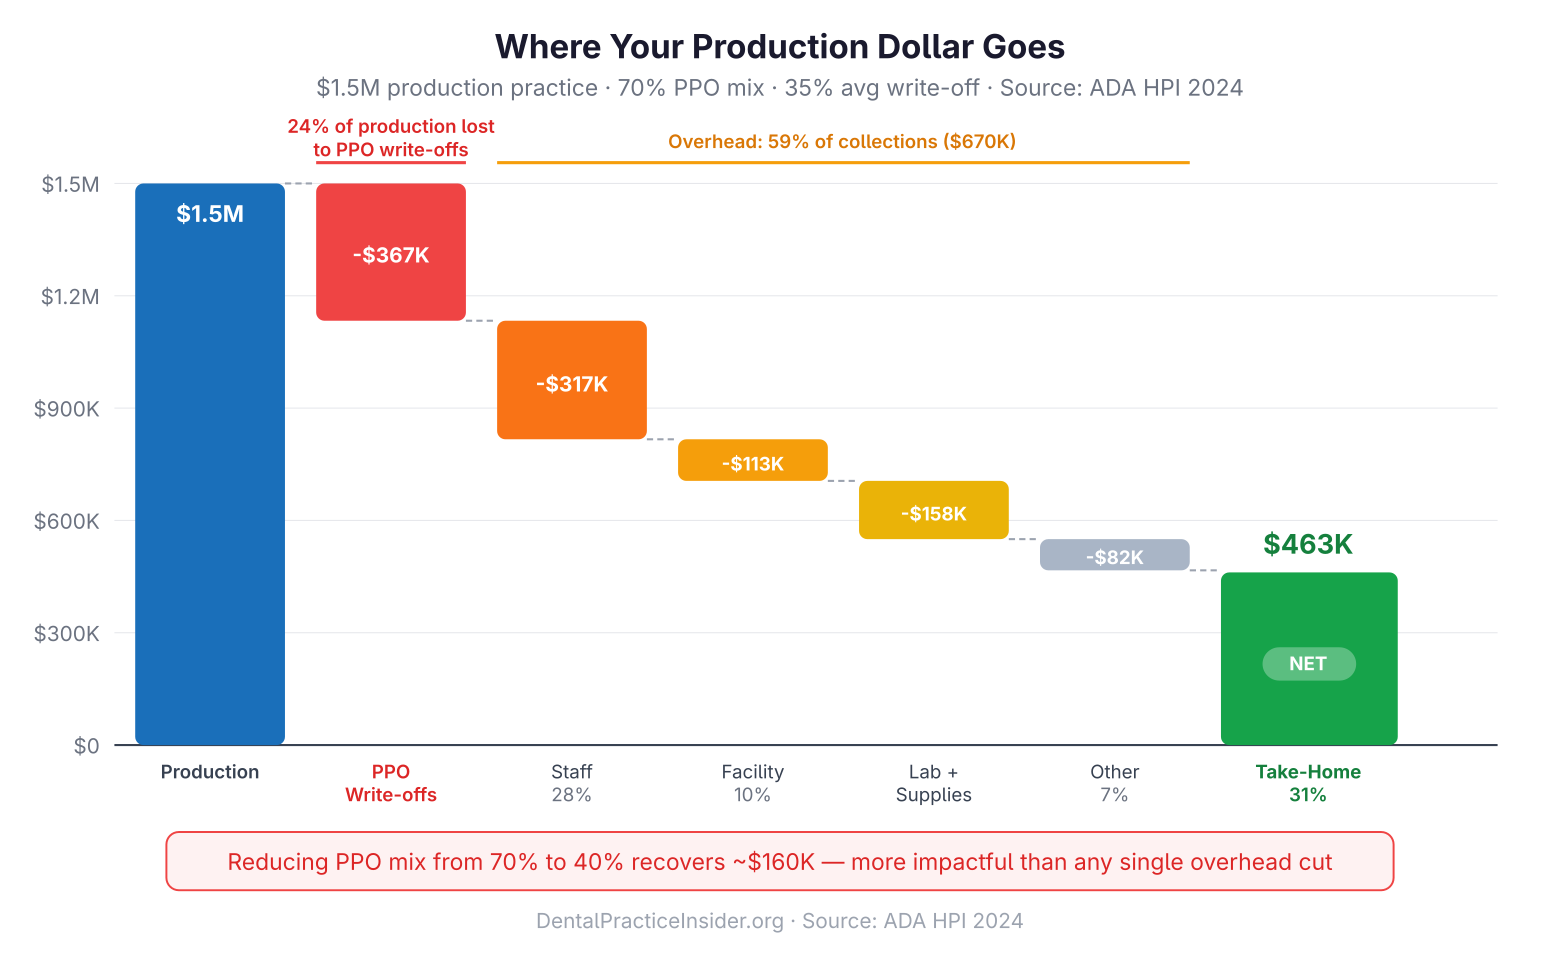
Overhead is every dollar that leaves your practice before it reaches your pocket. It includes staff payroll, dental supplies, lab fees, rent, equipment payments, software subscriptions, insurance, and marketing. Your overhead percentage—total expenses divided by gross collections—is the single most important financial ratio in your practice.
For related reading, see our guide on dental practice loans and financing.
A practice collecting $900,000 at 60% overhead nets $360,000. The same office at 70% overhead nets $270,000. That $90,000 gap represents years of retirement contributions, debt repayment, or personal financial security. This ratio isn’t an abstract accounting concept—it is the lever that determines your take-home pay. For a deeper look at what drives these gaps, see our breakdown of the 5 most expensive financial mistakes practice owners make. Curious how overhead reduction maps to practice value? Try the valuation calculator — it uses your adjusted net income to produce an EBITDA-based enterprise value.
For related reading, see our guide on retirement planning for dentists.
What Are the ADA Benchmark Overhead Percentages by Category?
Total dental office overhead should run 58–65% of gross collections. Staff payroll is the largest line at 25–28%, followed by laboratory fees at 7–10% and dental supplies at 5–7%. The ADA Health Policy Institute publishes annual survey data on practice overhead by category. The figures below represent 2024 benchmarks for general practices (ADA HPI, 2024):
| Overhead Category | ADA Benchmark (% of collections) | High-Performance Target |
|---|---|---|
| Staff / Payroll (excl. doctor) | 25–28% | 22–25% |
| Dental Supplies | 5–7% | 4–6% |
| Laboratory Fees | 7–10% | 6–8% |
| Occupancy (rent + utilities) | 5–8% | 4–6% |
| Equipment / Depreciation | 3–5% | 2–4% |
| Marketing | 3–5% | 3–5% |
| Professional Fees (CPA, attorney) | 1–2% | 1–2% |
| Insurance (malpractice, business) | 1–2% | 1–2% |
| Other / Miscellaneous | 2–4% | 1–3% |
| Total Overhead | 58–65% | 55–60% |
Specialty offices carry different benchmarks. Orthodontic practices, with minimal lab fees and fewer supplies, often run 50–55% cost structure. Oral surgery offices can run 60–68% running costs due to higher staff credentialing costs and facility requirements.
For related reading, see our guide on clear aligner profitability analysis.
Dental Office Expense Percentages by Category: Healthy, Warning, and Critical Ranges
Dental office expenses percentages tell you at a glance whether a practice is healthy or bleeding margin. Use the thresholds below to triage your dental office expense percentages against the category benchmarks above—anything in the “critical” column should be diagnosed within 30 days.
| Overhead Category | Healthy | Warning | Critical |
|---|---|---|---|
| Total office overhead | ≤65% | 66–68% | ≥69% |
| Staff / payroll | ≤28% | 29–32% | ≥33% |
| Laboratory fees | ≤10% | 11–13% | ≥14% |
| Dental supplies | ≤7% | 8–9% | ≥10% |
| Occupancy / facility costs | ≤8% | 9–11% | ≥12% |
| Equipment costs | ≤5% | 6–7% | ≥8% |
Each range expresses the line as a percentage of total collections. The thresholds are cumulative warning signs: a single category in the “warning” band rarely sinks a practice, but two or more in “critical” almost always pushes total office overhead past the 68% danger line.
How Do You Calculate Your Practice Overhead Percentage?
Practice overhead percentage = (total operating expenses ÷ total collections) × 100. The calculation is simple; the discipline to run it monthly is what separates well-run practices from struggling ones.
Overhead % = (Total Operating Expenses ÷ Gross Collections) × 100Example: If your practice collected $850,000 last year and total operating expenses (excluding doctor compensation) were $527,000, your overhead is 62%.
Key rules for accurate calculation:
- Exclude doctor compensation and owner’s draws from the expense total
- Use gross collections (cash actually received), not production or gross charges
- Include all expenses: payroll taxes, benefits, and profit-sharing contributions in the staff line
- Allocate one-time equipment purchases as depreciation, not a single-year expense
What Drives High Staff Overhead—and How Do You Fix It?
Staff is the largest controllable cost in most practices. When payroll exceeds 28% of collections, the root causes are almost always one of four things:
- Overstaffing: Too many team members per doctor. Benchmark: 4–5 total staff per full-time doctor (including hygiene)
- Underproduction: Staff levels are fine, but collections are low due to schedule gaps or insurance write-offs
- Wage creep without productivity growth: Annual raises without corresponding production increases
- High turnover costs: Each replacement hire costs $8,000–$15,000 in recruiting, training, and lost productivity (SHRM estimates, 2024)
Fix overstaffing gradually—through attrition, not sudden cuts. Fix underproduction by tightening the schedule (no more than 10% same-day openings) and reducing write-offs through fee review and PPO analysis.
How Do Lab Fees Get Out of Control—and What Can You Do?
Lab fees above 10% of collections are a signal. Common causes:
- Using premium offshore or boutique labs for all cases without tiering by complexity
- High crown remake rates (above 2–3%) signaling clinical or impression quality issues
- Not renegotiating lab contracts annually
- Lack of in-office milling (CAD/CAM) for single-unit restorations
A same-day crown milling system pays for itself in 18–30 months at most production levels while reducing lab fees and appointment-to-completion time. At $55,000–$140,000 capital cost, this is one of the better ROI equipment investments in dentistry.
What Overhead Optimization Strategies Deliver the Fastest Results?
- Renegotiate supply contracts quarterly. Patterson, Henry Schein, and Benco all have price-match programs. Buying groups can cut supply costs 8–15% immediately.
- Audit your PPO contracts. If a plan reimburses below 80% of your UCR fee, the math rarely works. Dropping low-paying plans raises collections per patient visit without adding a single new patient.
- Review rent vs. market rate. Lease renewals are negotiating opportunities. If you’ve been a tenant 5+ years, you likely have use.
- Consolidate software subscriptions. Most offices run 8–12 software tools with redundant functions. Auditing subscriptions typically saves $400–$900/month.
- Track overhead monthly, not annually. Monthly reports let you catch cost spikes within 30 days instead of discovering them at year-end tax time.
For a broader profitability framework that connects overhead management to practice growth, see our guide on improving dental practice profitability.
How Do Overhead Benchmarks Differ for Group Practices and DSOs?
DSO-managed offices often run 62–70% expense ratios due to management fees (typically 5–10% of collections paid to the DSO), centralized administrative costs, and higher marketing spend. The trade-off is centralized purchasing power that can lower supply and lab costs 10–15% compared to solo practices.
| Practice Type | Typical Overhead (% of collections) | Primary Driver |
|---|---|---|
| Solo general practice | 58–65% | Fixed costs carried by one provider |
| Multi-doctor group | 55–60% | Fixed costs spread across higher volume |
| DSO-managed office | 62–70% | Management fees (5–10%) offset by purchasing power |
| Orthodontic practice | 50–55% | Minimal lab and supply costs |
| Oral surgery practice | 60–68% | Higher staff credentialing and facility costs |
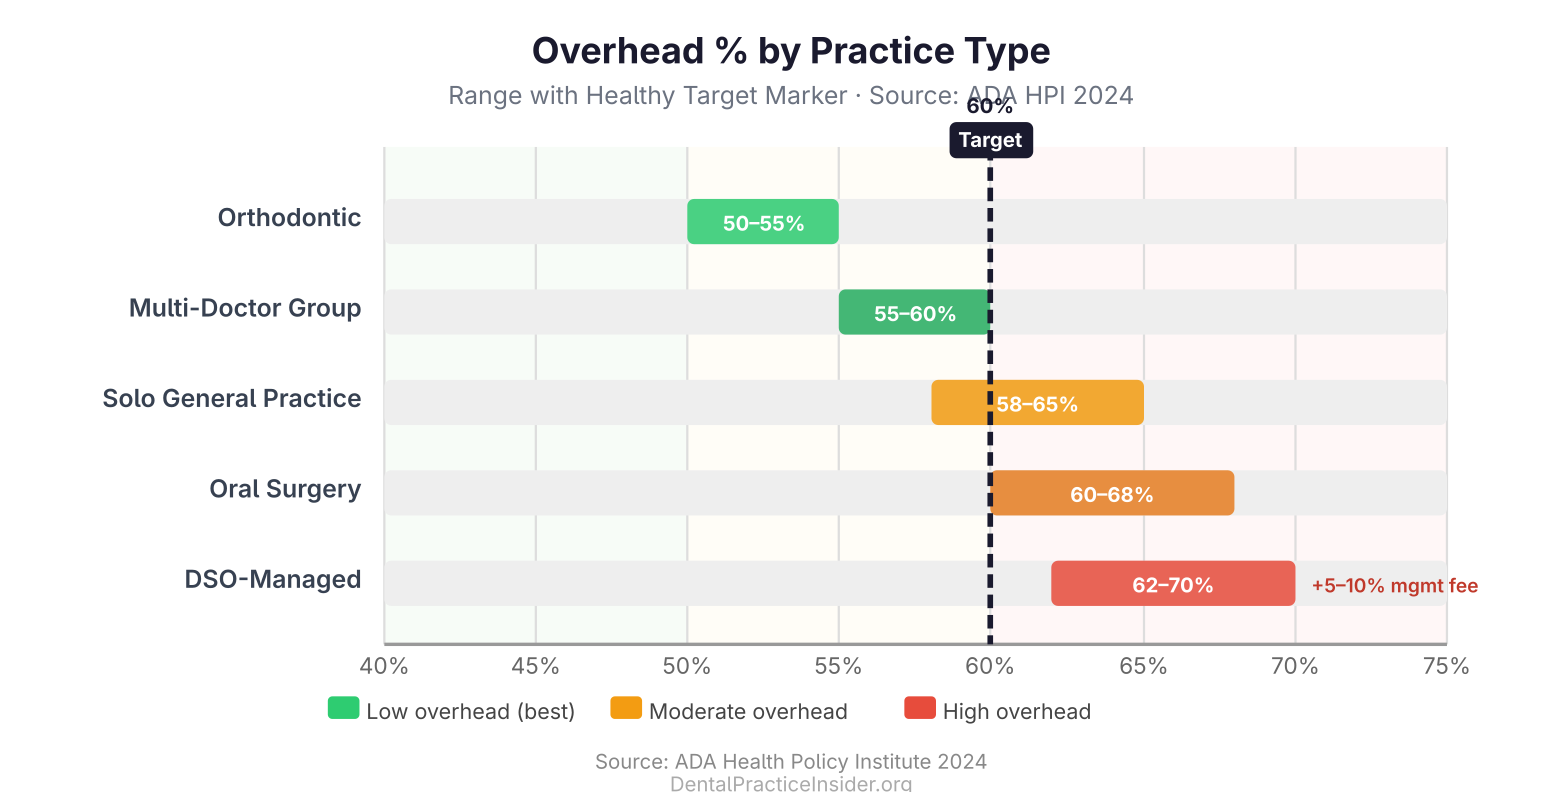
Multi-doctor group practices often achieve 55–60% overhead by spreading fixed costs (rent, administrative staff, equipment) across higher production volumes. Cost efficiency is one of the key financial arguments for group practice over solo ownership as practices scale.
For a complete overview of practice management guides and resources, visit our Dental Practice Growth & Management resource library.
For related reading, see our guide on how overhead benchmarks feed directly into your break-even calculation.
For related reading, see our guide on why your fee schedule must stay ahead of overhead growth to maintain margins.
Frequently Asked Questions
What is a good overhead percentage for a dental practice?
60–65% is typical for a well-run general practice. Under 60% is excellent. Above 68% signals a problem that needs immediate attention. Specialty practices vary—orthodontics commonly runs 50–56%.
Does overhead percentage change with practice size?
Yes. Larger practices can spread fixed costs over more revenue, driving overhead down. A practice collecting $600,000 might run 65% overhead; the same clinic at $1.2M often runs 58–60% because rent, software, and management overhead don’t double with collections.
Should I include my own salary in overhead calculations?
No. Owner compensation is the result—not an input—to the overhead calculation. Calculate overhead excluding your draw or salary, then what remains after overhead is your gross compensation (before taxes and retirement contributions).
How often should I review overhead benchmarks?
Monthly at minimum. Quarterly deep-dives by category. Annual comparisons against ADA HPI benchmark data. Practices that review overhead monthly catch problems in 30 days; those that review annually often discover them after losing $30,000–$80,000 in preventable expense.
What’s the fastest single change to reduce overhead?
Renegotiating or dropping your lowest-reimbursing PPO plan. This doesn’t reduce any expense line directly, but it raises collections per patient visit, which immediately improves your overhead percentage. Results typically appear within 60–90 days of implementation.
For more resources on this topic, see our complete guide to dental practice financial management.

Sajid Ahamed is a dental practice-management content strategist with 7+ years of experience marketing for dental practices. He writes DPI’s practice-finance guides, turning operational benchmarks like overhead ratios into decisions practice owners can act on. Connect on LinkedIn.
Practices evaluating PPO contracts can model the revenue impact using our PPO Drop Economics guide.