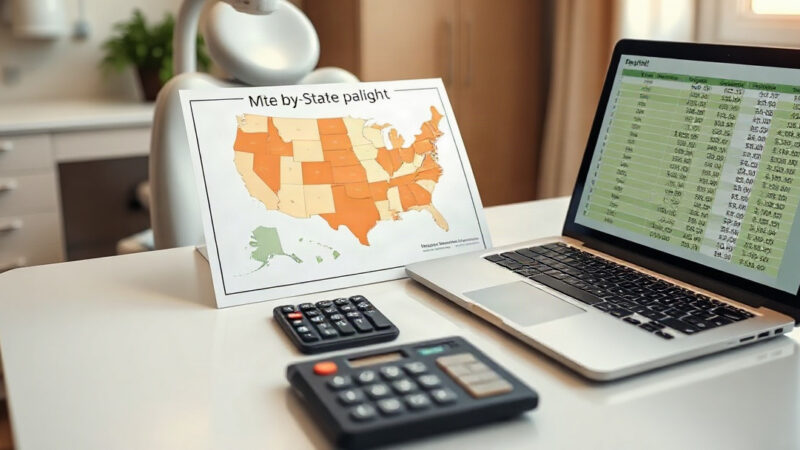
The median dental assistant salary in the United States is $48,070 per year as of September 2026, based on Bureau of Labor Statistics (BLS) Occupational Employment and Wage Statistics (OEWS) data for SOC 31-9091, but the national figure hides a spread most “dental assistant salary by state” pages never surface. Minnesota pays a median of $65,270; Utah pays $37,760. That’s a 73% difference for the identical job title, wider than any state-to-state gap DPI has documented in its five-state dental hygienist salary series. And the state at the very bottom isn’t one of the usual low-cost-of-living suspects: Utah out-lows West Virginia, Alabama, and Mississippi, which is genuinely counterintuitive for a state that isn’t otherwise a low-income economy. This guide publishes the full 50-state-plus-DC table, sourced directly from BLS with a stated methodology, and walks practice owners through what it means for pay bands, loaded cost, and the assistant-to-hygienist staffing ratio.
What Is a Dental Assistant Salary, and Why the State-Level Number Matters
A dental assistant salary is the compensation paid to a person performing chairside clinical support: instrument transfer, suction, sterilization, impressions, and (in states that permit it) expanded functions, tracked federally under BLS Occupational Employment and Wage Statistics (OEWS) code SOC 31-9091. This guide uses the most recent BLS OEWS release (May 2025, published in 2026 and current as of September 2026) to break down what dental assistants earn in every state plus the District of Columbia. Nationally, the occupation’s annual wage distribution runs from a 10th percentile of $37,130 to a 90th percentile of $62,250, with a mean of $50,200 and a median of $48,070: a wide enough spread on its own that a single national number was never going to be useful for budgeting a specific hire. The state breakdown below is where the real planning value sits.
The 73% Spread: Minnesota vs. Utah
Minnesota’s dental assistant median of $65,270 and Utah’s $37,760 aren’t outliers in a tight distribution. They’re the top and bottom of a genuinely wide national range. The gap between them is 73% of Utah’s own median, meaning a Minnesota dental assistant earns nearly three-quarters more than a Utah dental assistant doing the same job. For comparison, the widest state-to-state gap DPI has documented across its five-state dental hygienist salary series, California’s $124,930 median against Florida’s $91,980, runs about 36%. The dental assistant spread, measured across all 50 states plus DC rather than five selected states, is roughly double that. For a multi-state DSO or a group planning to expand into a new state, that’s not a rounding error in a staffing model; it’s the difference between a hire that clears budget easily and one that doesn’t pencil at all without a wage adjustment.
Utah Is the Lowest-Paying State in the Country
Look at the bottom of the national table and the expected pattern mostly holds: Mississippi, Alabama, West Virginia, and Arkansas, states with some of the lowest costs of living in the country, cluster near the floor. Utah breaks that pattern. It isn’t a low-cost-of-living state in the way Mississippi or West Virginia are, yet its $37,760 median is the single lowest of all 50 states and DC, below West Virginia’s $37,960, Alabama’s $39,080, and Mississippi’s $39,160.
DPI can’t source a cause for this from BLS data, the OEWS release reports wages, not the labor-market dynamics behind them, so what follows is DPI’s own reasoning, not a sourced finding. Utah has a notably young population and a high concentration of dental assisting training programs relative to its size, which plausibly produces an abundant supply of newly credentialed entry-level assistants competing for openings. Abundant entry-level supply, all else equal, puts downward pressure on wages regardless of the state’s broader cost structure. That’s a hypothesis DPI is putting forward for readers to weigh, not a finding backed by a labor-supply dataset.
What the Utah anomaly does demonstrate cleanly is that cost of living alone does not explain this map. Hawaii is the other break in the pattern, in the opposite direction: it’s one of the highest-cost-of-living states in the country, yet its $44,720 median sits 7.0% below the national figure, not the lowest in the country, but well below what its cost structure alone would predict. A state with rock-bottom cost of living paying rock-bottom wages is unsurprising. A moderate-cost state (Utah) paying the literal lowest wages in the nation, and a sky-high-cost state (Hawaii) still paying below the national median, both say the same thing: local labor supply and demand are doing at least as much work as cost of living in setting this occupation’s pay.
Dental Assistant Salary by State (2026): Full 50-State Table
The table below reproduces the BLS OEWS May 2025 median annual wage for SOC 31-9091 Dental Assistants for 49 states and the District of Columbia, ranked highest to lowest, with each state’s variance from the national median of $48,070 shown for quick benchmarking. No figure below is a DPI estimate. Every value comes directly from the BLS pull described in the methodology note at the end of this guide.
A note on completeness: Kansas is not included in this table. DPI’s verified BLS OEWS pull returned all 50 states plus DC for every other state, but Kansas was not returned in that pull, and rather than estimate a figure DPI is disclosing the gap and omitting the row entirely, consistent with how this series has always handled genuine data gaps in prior installments. Readers needing a Kansas figure specifically should consult the BLS OEWS release directly.
| Rank | State | Median Annual Wage | vs. National Median |
|---|---|---|---|
| 1 | Minnesota | $65,270 | +35.8% |
| 2 | District of Columbia | $60,580 | +26.0% |
| 3 | Maine | $60,070 | +25.0% |
| 4 | New Hampshire | $59,530 | +23.8% |
| 5 | Oregon | $59,490 | +23.8% |
| 6 | Washington | $58,090 | +20.8% |
| 7 | Massachusetts | $57,980 | +20.6% |
| 8 | North Dakota | $57,770 | +20.2% |
| 9 | Alaska | $57,710 | +20.1% |
| 10 | Connecticut | $56,850 | +18.3% |
| 11 | Vermont | $52,760 | +9.8% |
| 12 | North Carolina | $50,380 | +4.8% |
| 13 | Rhode Island | $50,150 | +4.3% |
| 14 | California | $50,110 | +4.2% |
| 15 | New Jersey | $49,390 | +2.7% |
| 16 | Arizona | $49,000 | +1.9% |
| 17 | Michigan | $48,820 | +1.6% |
| 18 | Indiana | $48,670 | +1.2% |
| 19 | Maryland | $48,620 | +1.1% |
| 20 | Illinois | $48,610 | +1.1% |
| 21 | Iowa | $48,430 | +0.7% |
| 22 | Colorado | $48,340 | +0.6% |
| 23 | New York | $48,110 | +0.1% |
| 24 | Ohio | $47,970 | −0.2% |
| 25 | Pennsylvania | $47,930 | −0.3% |
| 26 | South Dakota | $47,900 | −0.4% |
| 27 | Kentucky | $47,730 | −0.7% |
| 28 | Florida | $47,620 | −0.9% |
| 29 | Delaware | $47,600 | −1.0% |
| 30 | Wisconsin | $47,520 | −1.1% |
| 31 | South Carolina | $47,320 | −1.6% |
| 32 | Nevada | $47,110 | −2.0% |
| 33 | Georgia | $46,840 | −2.6% |
| 34 | Tennessee | $46,720 | −2.8% |
| 35 | Montana | $46,680 | −2.9% |
| 36 | Virginia | $46,670 | −2.9% |
| 37 | Nebraska | $46,660 | −2.9% |
| 38 | Missouri | $45,970 | −4.4% |
| 39 | Idaho | $45,880 | −4.6% |
| 40 | Oklahoma | $45,740 | −4.8% |
| 41 | Texas | $45,430 | −5.5% |
| 42 | Wyoming | $44,990 | −6.4% |
| 43 | Hawaii | $44,720 | −7.0% |
| 44 | New Mexico | $44,400 | −7.6% |
| 45 | Louisiana | $44,090 | −8.3% |
| 46 | Arkansas | $42,830 | −10.9% |
| 47 | Mississippi | $39,160 | −18.5% |
| 48 | Alabama | $39,080 | −18.7% |
| 49 | West Virginia | $37,960 | −21.0% |
| 50 | Utah | $37,760 | −21.4% |
| N/A | U.S. National | $48,070 | N/A |
Two things stand out. First, the top of the table is dominated by states without a major Sun Belt low-cost-of-living profile: Minnesota, Maine, New Hampshire, Oregon, and the northern-tier states generally out-pay the national median by 20% or more. Second, exactly half the country’s states plus DC sit within about 5 percentage points of the national median on either side, the real story in this data is less about a smooth gradient and more about a cluster of 20-plus states bunched near the middle, bookended by two genuinely wide tails.
Dental Assistants vs. Dental Hygienists: The Pay Ratio Employers Should Watch
Set next to DPI’s dental hygienist salary series, the dental assistant figures make a second pattern visible: dental assistants earn roughly half of what dental hygienists earn for the same practice. The national dental assistant median ($48,070) is 49.0% of the national dental hygienist median ($98,100), almost exactly half.
That ratio isn’t constant across states, and the variation is a real staffing-model lever for owners, not just a curiosity. Using the five states already covered in DPI’s hygienist series alongside this guide’s dental assistant figures:
| State | Dental Assistant Median | Dental Hygienist Median | Assistant-to-Hygienist Ratio |
|---|---|---|---|
| California | $50,110 | $124,930 | 40.1% |
| New York | $48,110 | $106,130 | 45.3% |
| Texas | $45,430 | $99,240 | 45.8% |
| U.S. National | $48,070 | $98,100 | 49.0% |
| Georgia | $46,840 | $95,490 | 49.1% |
| Florida | $47,620 | $91,980 | 51.8% |
California has the widest gap of the five: a California dental assistant earns just 40.1% of what a California dental hygienist earns, versus 51.8% in Florida. The wider that gap runs, the more economically attractive expanded-function dental assistant (EFDA) utilization becomes. Shifting procedures a hygienist would otherwise perform to a lower-cost, appropriately credentialed assistant closes more of the cost differential in a high-gap state like California than in a narrow-gap state like Florida. Where the ratio sits closer to 50%, as in Florida and Georgia, the financial case for building out EFDA capacity is comparatively weaker; the labor-cost arbitrage simply isn’t as large. This is a directional read on the economics, not a scope-of-practice determination, EFDA-permitted procedures vary by state and are a licensure question that should be verified against each state’s dental board, not inferred from a pay ratio alone.
How to Use This Table to Set a Defensible Pay Band
The single national median is the least useful number in this entire dataset for setting an actual offer. Two figures matter more:
- Your state’s row in the table above. Start there, not the national figure: a Texas practice benchmarking off the $48,070 national median instead of Texas’s own $45,430 will overshoot its real market by roughly $2,600 per hire before any other adjustment.
- The national interquartile band: $44,340 (p25) to $58,090 (p75). This band matters more than the median alone because it shows the realistic negotiating range once experience, certification, and local demand are factored in. A candidate at the 25th percentile and one at the 75th percentile are both being paid “normally” for the occupation nationally. The median just marks the center of that range, not a ceiling or floor.
A defensible pay band, in practice, is your state’s median adjusted toward the top or bottom of the national p25. P75 spread based on the specific candidate’s certification, tenure, and the local labor market, not a single flat number applied to every hire regardless of experience.
Certification and Its Likely Pay Effect
BLS OEWS does not break out wages by certification status, so nothing below is a BLS figure. It’s DPI’s qualitative read of how the credentialing landscape likely affects pay. The Dental Assisting National Board’s Certified Dental Assistant (CDA) credential is the most widely recognized national certification, and many states layer additional state-specific registration or licensure requirements (particularly for expanded functions like coronal polishing, sealant placement, or orthodontic procedures) on top of it. Practices generally pay a premium for CDA-certified assistants and for assistants credentialed to perform expanded functions, since that credentialing directly expands what the assistant can legally do in the operatory, but DPI has no sourced figure for the size of that premium and isn’t publishing an invented percentage here. Owners setting pay should treat certification and expanded-function credentialing as a real, positive input into where a specific hire lands in the p25, p75 band, without assuming a specific dollar amount without verifying local norms.
The Loaded-Cost View: What a Dental Assistant Actually Costs to Employ
Wage is the number a candidate negotiates. Total loaded cost is the number a practice has to budget, and DPI applies the same editorial multiplier used throughout its hygienist salary series to keep the framework consistent across roles: 1.25-1.32× base wage once payroll tax, benefits, retirement match, and PTO are itemized on top.
Illustrative DPI editorial model, not a BLS figure. The 1.25-1.32× multiplier is DPI’s own estimate, carried over from this site’s dental hygienist salary series for consistency, not a separately sourced dental-assistant-specific statistic. Actual loaded cost varies by state payroll tax rates, benefits package, and practice size.
Applying the 1.285× midpoint to the national median ($48,070) puts fully loaded cost at roughly $61,770 per year. The same multiplier against the national p25 ($44,340) and p75 ($58,090) puts loaded cost at roughly $56,980 and $74,650 respectively, and against the two extremes in this guide’s table, Minnesota’s $65,270 median loads out to roughly $83,870, while Utah’s $37,760 median loads out to roughly $48,530. That’s a real illustration of how far the state-level spread compounds once it’s carried through a full staffing budget, not just a wage line.
Run whichever figure applies to your state and hire against your practice’s overall staffing budget before finalizing an offer. The wage line alone consistently understates what a new dental assistant hire actually costs.
Why Assistant Turnover Costs More Than the Wage Suggests
Dental assistant turnover is expensive relative to the wage in a way that’s easy to underestimate, because most of the real cost never shows up as a line item labeled “turnover.” DPI has no sourced turnover-rate statistic for this occupation and isn’t publishing an invented one, what follows is a structural argument, not a benchmark.
Illustrative DPI editorial model, hypothetical numbers, not sourced turnover data. This is a mechanic, not a benchmark; real replacement costs depend on your market, chair utilization, and how quickly a role gets backfilled.
Say a practice loses a dental assistant earning the national median ($48,070). Before a replacement is fully productive, the practice typically absorbs some combination of: reduced chairside throughput while the seat sits open or is covered by a doctor or hygienist working without support, recruiting and interview time pulled from the office manager’s or owner’s schedule, and a ramp period, commonly assumed in the range of several weeks to a few months, during which a newly hired assistant works at less than full efficiency while learning the practice’s systems. None of those costs appears on a P&L as “turnover expense”; they show up as softer production, more overtime for remaining staff, or delayed case starts. That’s why the wage line alone understates the true cost of losing and replacing an assistant, even without a specific turnover-rate statistic to cite.
The practical implication for owners: paying above your state’s p25 figure is a retention decision as much as a recruiting one. An assistant hired at or near the bottom of the local range has the least reason to stay once a competing practice offers a modest raise, and the replacement cost above almost always exceeds the wage difference an owner was trying to save by anchoring low in the first place.
Why Salary Aggregators and BLS Disagree
A live search for “dental assistant salary by state” surfaces a familiar mix: DANB, Stepful, DentalPost, AllAlliedHealthSchools, ZipRecruiter, and Becker’s Dental Review all rank for the term, alongside BLS.gov itself. Most of those aggregator pages build their figures from self-reported user data, site visitors entering their own pay into a form, rather than a probability-based employer survey. Self-reported salary data skews toward whoever chooses to submit a number, tends to over-represent higher-paid or more engaged users, and typically doesn’t disclose a sample size or methodology a reader can evaluate.
BLS OEWS, by contrast, surveys a large, stratified sample of actual employers across every state and reports median, mean, and full percentile distributions with a published methodology. That’s the real differentiator this guide is built on: DPI is publishing the government source, in full, with every state shown and the methodology stated plainly, rather than a self-reported aggregate presented as if it were authoritative. Readers comparing this table against an aggregator site’s numbers should expect some divergence. That’s the self-reported-versus-surveyed gap showing up, not an error in either source.
Frequently Asked Questions
How much do dental assistants make by state?
Dental assistant pay ranges from $37,760 (Utah, the lowest) to $65,270 (Minnesota, the highest) per year across the 50 states and DC, based on BLS OEWS May 2025 data for SOC 31-9091. The national median is $48,070.
What state pays dental assistants the most?
Minnesota, at a median of $65,270 per year, about 35.8% above the national median of $48,070, per BLS OEWS May 2025 data.
What state pays dental assistants the least?
Utah, at a median of $37,760 per year: the lowest of all 50 states and DC, below even West Virginia, Alabama, and Mississippi, which are more traditionally low-cost-of-living states.
Why is Utah the lowest-paying state for dental assistants if it isn’t a low-cost-of-living state?
BLS doesn’t report a cause, so this is DPI’s own reasoning rather than a sourced finding: Utah has a notably young population and a high concentration of dental assisting training programs, which plausibly produces an abundant supply of entry-level assistants and puts downward pressure on wages independent of the state’s broader cost structure.
How much less do dental assistants make than dental hygienists?
Nationally, dental assistants earn about half of what dental hygienists earn: a median of $48,070 versus $98,100, a ratio of 49.0%. That ratio varies by state, from 40.1% in California to 51.8% in Florida among the states DPI has covered in its hygienist series.
What is a good salary range for a dental assistant?
Nationally, the middle half of dental assistants earn between $44,340 (25th percentile) and $58,090 (75th percentile) per year. That band, adjusted for your specific state’s median from the table above, is a more useful benchmark than the national median alone.
Does dental assistant pay vary by certification?
BLS doesn’t break out wages by certification, so DPI can’t cite a specific premium, but a Certified Dental Assistant (CDA) credential from DANB and state-specific expanded-function credentialing generally command higher pay because they directly expand what an assistant can legally perform, verify the size of any premium against local norms rather than assuming a fixed figure.
How much does it actually cost a practice to employ a dental assistant?
Once payroll tax, benefits, retirement contributions, and PTO are added, DPI’s editorial estimate puts fully loaded cost at roughly 25-32% above base wage, meaning a $48,070 national median wage costs a practice roughly $61,770 per year in total, with Minnesota’s median loading out near $83,870 and Utah’s near $48,530.
Why do salary sites disagree on dental assistant pay?
Most salary aggregator sites (ZipRecruiter, Salary.com-style tools, and similar) build figures from self-reported user data, which skews toward whoever submits a number and rarely discloses a sample size or methodology. BLS OEWS surveys a large, stratified sample of actual employers and publishes its methodology, which is why this guide is built on BLS rather than an aggregator.
Is expanded-function dental assisting (EFDA) worth building out?
It’s a stronger economic case in states where the assistant-to-hygienist pay ratio is wide (California, at 40.1%, is the widest among the states DPI has covered) and a weaker case where the ratio is narrow (Florida, at 51.8%). EFDA scope of practice varies by state and is a licensure question that should be verified against your state dental board, not inferred from pay data alone.
Related Resources
This guide pairs with DPI’s five-state dental hygienist salary series: Texas, Florida, California, New York, and Georgia: and with DPI’s broader staff compensation coverage: Dental Office Manager Pay Bands & Bonus Structures, Dental Staff Hiring & Compensation, and the parent analysis, Dental Hygienist Shortage: The Economics of the Gap. See also DPI’s Practice Growth & Management hub for the full staffing and operations library. DPI’s dental hygienist bonus structures guide, covering incentive design across this same compensation family, is scheduled for publication later this month.
Sources: U.S. Bureau of Labor Statistics, Occupational Employment and Wage Statistics, May 2025 release (most recent available as of September 2026), SOC 31-9091 Dental Assistants, via the BLS OEWS public data, with a canary series verified in every batch to rule out API truncation. Kansas is omitted from the state table because it was not returned in DPI’s verified pull; this is a disclosed data gap, not a DPI estimate of zero. The dental hygienist figures referenced for comparison (SOC 29-1292) come from the same BLS OEWS May 2025 release and DPI’s companion hygienist salary series. The loaded-cost multiplier, certification pay effect, turnover cost mechanic, and EFDA economics discussion are DPI editorial estimates and reasoning, not separate BLS statistics, and are labeled as such throughout.
Last updated: October 19, 2026